Tuesday, February 27, 2007

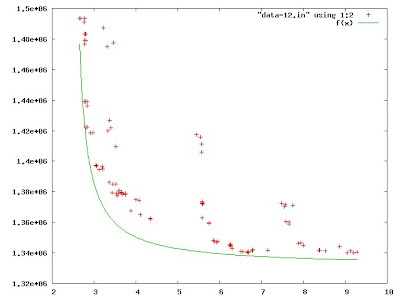
Plot shows the performance of variable compression-level settings, x (time) and y (compressed size), tested on a specific pair of cached 130MB inputs.
Compression has an inverse relation between time and space performance. The green line is a hyperbola for reference, f(x) = 1.33MB + (30KB*s) / (x - 2.45s). Sample points:
1.49MB in 2.9sec at ~45MB/sec (98.9% compression)
1.34MB in 6.5sec at ~20MB/sec (99.0% compression)
Comments:
Post a Comment